1 data input and parameter settings
1.1 data input
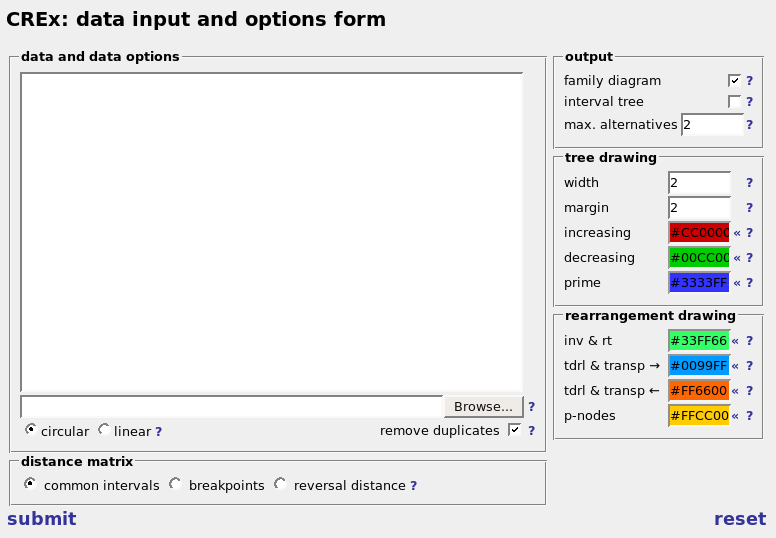
in the data and data options area the user can input the gene order data. there are two ways of doing this. you can either input the gene order data in the text field manually or upload a file containing the gene orders. the format of the gene order data is the same in both cases and similar to the fasta format. each genome is represented by a line starting with '>' followed by the name of the species and a line (or lines) giving the order of the genes of the species. each gene is represented by a string and can be preceded by a minus sign, indicating that the gene is located on the other strand. in the name of the gene all characters are allowed - except for spaces - brackets '{[()]}' are deleted from the gene names. (empty lines and lines starting with '#' are ignored)Example:
> Species 1
G1 G2 G3 G4 G5
> Species 2
G5 G1 G2 -G4 -G3
in this example two gene orders with the names 'Species 1' and 'Species 2' are defined. the gene orders have the same set of genes (G1,...,G5). in Species 2 the genes are rearranged (relative to the order in Species 1) and G3 and G4 are located on the other strand.
important notes:
- it is not possible to include duplicated genes in the analysis, i.e. each gene is allowed only once per gene order. to circumvent this genes occurring more than one time in one input sequence are removed completely.
- for each comparison the set of genes has to be identical, therefore genes which are in one gene order but not in the other are also removed.
circular and linear genomes are treated in slightly different ways. the user has to select if the genomes are circular or linear genomes, in order to treat them correctly. this can be specified with the radio buttons below. the default value is 'circular' which seems to be useful for mitochondrial genomes.
the data set may contain equal gene orders. if the 'remove duplicates' checkbox is selected all but one of the equal gene orders are deleted from the data set. If CREx deletes duplicates gene orders the user gets also warning messages.
1.2 parameter settings
in the distance matrix section on the bottom the type of distance matrix which should be presented can be chosen. further details are presented in the following.in the output section you can specify the kind of tree CREx should present. the possibilities are the family diagram and the string interval tree. it is possible to select one, both, or none. its necessary and useful to limit the number of alternative scenarios to present. this can be done with the 'max. alternatives' input field.
the tree and rearrangement drawing allows the user to specify options regarding the drawing of the tree, and the highlighting of the proposed scenarios. the options are applied to the drawing of the family diagram as well as the strong interval tree. it is possible to specify the line width of the boxes, and the margin which separates each box from its content (in the case of the family diagram this is other boxes and for the strong interval tree it is the text inside). the last options are about colors. the colors can be selected by clicking on '«'. if you need other colors you have to specify them in the input field in the usual hex-format. you can specify the colors of the three different node types and the colors for highlighting the different rearrangements identified by CREx.
2 distance matrix
after submitting the gene order data, CREx presents a distance matrix of all gene orders. with the help of the distance matrix you can select pairs of species from the data set for the comparison. CREx offers three different distance measures: 1) the number of common intervals, 2) the number of breakpoints, and 3) the reversal distance. note that the number of common intervals is a similarity measure while the other two are dissimilarity measures, i.e. high numbers of common intervals mean similar gene orders, while high numbers of breakpoints (or reversals) mean dissimilar gene orders. in order to simplify the recognition of gene orders with a small evolutionary distance, the values in the distance matrix are color coded. bright color represent similar genomes and dark colors represent dissimilar gene orders.in order to select a pair of species for the comparison the corresponding entry of the matrix can be selected. the corresponding species pairs are highlighted with bold text. you can also select complete rows and columns by clicking on the header row or columns. the cell on the top left of the matrix marks the complete matrix. to show the comparisons for the selected pairs the submit button has to be pressed.
for circular genomes it is possible to rotate the genomes. you can select a gene from the drop down list below the matrix which should be at the first position in the comparisons. you can choose from the set of genes which are present in all genomes of the current data set. the rotation will not influence the distance matrix, but may influence the pairwise comparisons. note that the number of operations stays the same (with the exception of the heuristically determined combined reversal tdrl scenarios for prime nodes) while the configuration of the gene order rearrangements may change. e.g. a transposition can be performed the other way round the circular genome or instead of applying a certain inversion the other 'half' of the circle could be inverted as well with the 'same' (from a gene order point of view) result. for the tdrl scenarios the number of transpositions/tdrl may change because the computation of the tdrl scenarios (Chaudhuri et al. 2006) interprets transposition as trivial tdrls, i.e. it does not differentiate between the two operations (the classification in transpositions / tdrls is done by CREx as a postprocessing step).

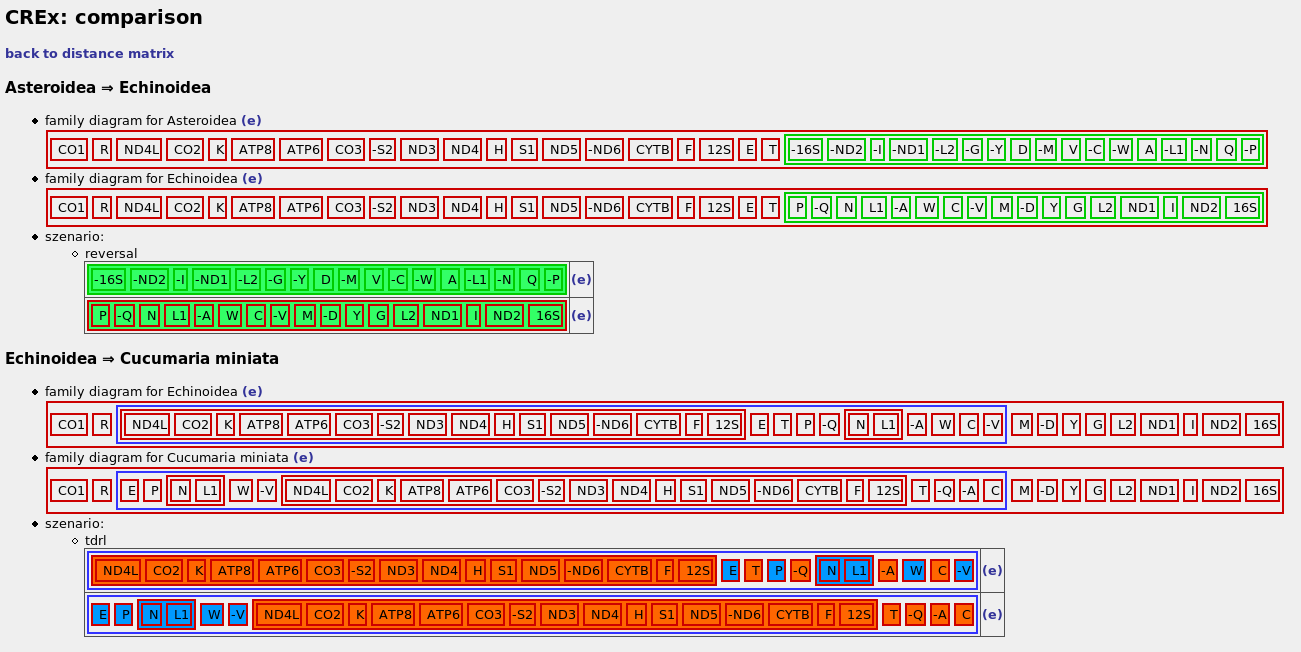
3 the comparisons
on the comparison page CREx presents the pairwise comparisons, that were selected in the distance matrix. for each pair the following is shown:- depending on the selection you made in the form: the family diagrams of the gene orders (similar to Bergeron,Stoye 06), or their strong interval trees
- the heuristically determined list of rearrangements needed to transform the first gene order into the other. (the direction of the scenario is only important if it includes tdrls). note: clicking on the names of the operation marks them in the family diagram (if shown) in order to simplify their localization.